Air quality has become a daily concern in many cities. People want to know what they are breathing, not hours later, but right now. This is where LED screens boards play an important role. They turn invisible data into visible information that people can understand at a glance.
Unlike mobile apps that require active checking, large LED displays bring air quality data into public spaces. They make environmental information open, direct, and hard to ignore.
Why LED Screens Boards Fit Real-Time Air Quality Display
Real-time air quality data changes fast. PM2.5, PM10, AQI, temperature, and humidity can shift within minutes. LED screens handle this dynamic content well because they update instantly and remain visible in all lighting conditions.
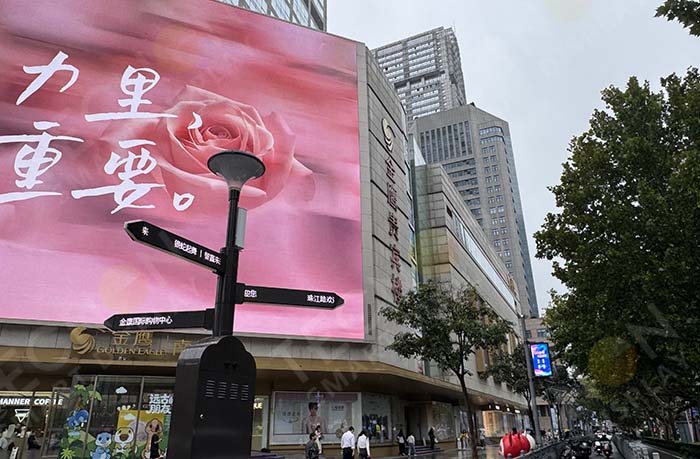
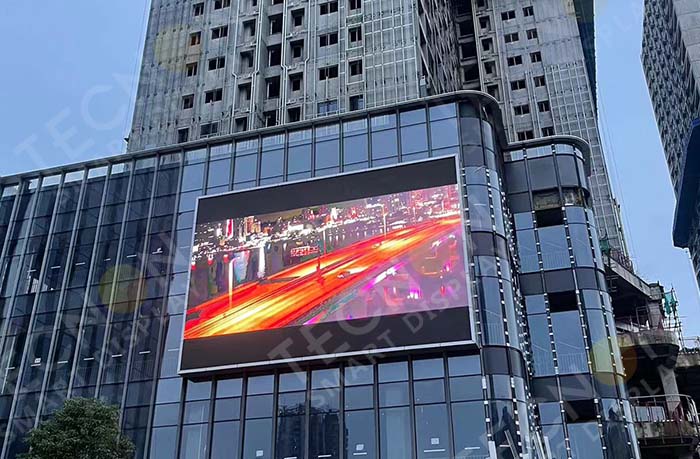
High brightness allows clear viewing outdoors, even under direct sunlight. Large formats make numbers and color indicators easy to read from a distance. This visibility turns technical data into public awareness.
Compared with traditional LCD signage, LED boards last longer and handle harsh environments better. This matters when screens operate 24/7 in streets, parks, or transportation hubs.
Turning Complex Data into Simple Visual Language
Air quality data can feel abstract. Numbers alone do not help most people decide what to do. LED display boards solve this by combining data with simple visual logic.
Color coding works well. Green signals good air. Yellow shows moderate conditions. Red warns of health risks. Clear icons help people understand whether to wear masks, limit outdoor activity, or proceed as normal.
Good content design avoids clutter. The screen focuses on key indicators instead of overwhelming viewers. This balance keeps the message clear and actionable.
Integration with Sensors and Data Platforms
Behind every air quality display is a data network. LED boards connect to IoT sensors, environmental monitoring stations, or cloud platforms. These systems collect and process data before sending it to the display.
Stable data integration matters. Delayed or inaccurate updates reduce trust. Professional systems use automated syncing to ensure the display always shows the latest readings.
Many smart cities already use this setup. The LED board becomes the visible layer of a much larger environmental monitoring system.
Placement Matters as Much as Technology
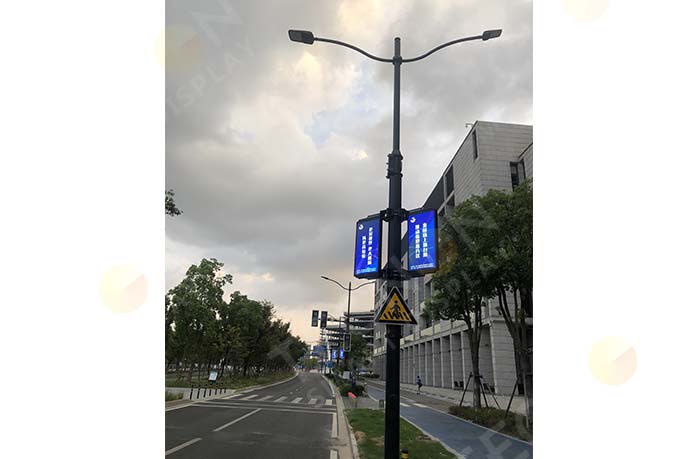
Where the screen sits affects how people use the information. LED panel installed near schools, hospitals, parks, or busy intersections serve a clear purpose. They reach people when decisions matter.
In transportation areas, air quality displays help commuters plan routes or adjust travel times. In commercial zones, they show that local authorities care about public health.
Proper placement also protects the hardware. Designers consider airflow, sunlight angle, and viewing distance during installation.
Reliability and Continuous Operation
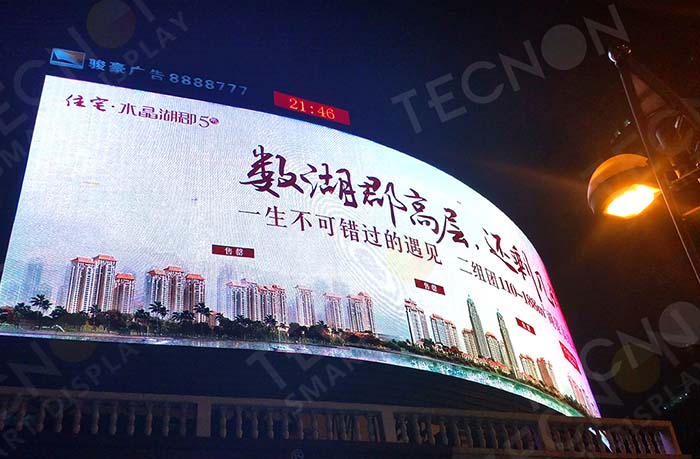
Air quality does not stop changing at night. LED screens often run around the clock. This makes reliability a key requirement.
Good thermal design prevents overheating. Quality power supplies reduce failure risks. Weatherproof cabinets protect components from rain and dust. These details keep the display stable over years of operation.
Regular remote monitoring helps operators detect issues early. This reduces downtime and maintenance costs.
Educating the Public Through Consistent Exposure
One major advantage of LED screens boards is repetition. People see the same information every day. Over time, they learn what different air quality levels mean.
This passive education builds awareness without effort. Residents begin to recognize patterns, such as seasonal pollution or rush-hour spikes. This knowledge encourages long-term behavior change.
Schools and community centers often use LED boards as part of environmental education programs.
Supporting Data-Driven City Decisions
Public air quality displays do more than inform citizens. They also support transparency. When people see real data in public spaces, trust improves.
City managers can use LED screens boards to show the impact of traffic control, construction limits, or environmental policies. Data visualization turns abstract policies into visible results.
This feedback loop strengthens data-driven governance.
The Future of Environmental Visualization
As sensor networks expand, LED screens will display more than basic AQI numbers. Future systems may include pollen levels, UV index, or health advice based on local conditions.
Interactive features may allow users to scan QR codes for deeper data. AI could adjust content based on crowd density or time of day.
The screen becomes not just a display, but a communication tool between cities and citizens.
Why LED Screens Boards Matter for Smarter Cities
Air quality affects everyone. When data stays hidden in reports, it fails to create impact. LED screens boards bring that data into daily life.
They turn numbers into meaningful insights, helping people make healthier choices and improving transparency. Most importantly, they remind people that the environment matters right now, not later.